The Nuggets Efficiency Masterclass: Why TS% Is Telling You Something eFG% Can't
NBA Advanced Analytics | Denver Nuggets Offensive Breakdown**
Most bettors stare at the box score like it's a crystal ball. Field goal percentage. Three-point shooting. Points in the paint. And then they wonder why they keep losing money on what looked like "easy unders."
Here's the problem: **You're watching the wrong numbers.**
While casual bettors are fixated on whether shots are falling, sharp bettors are tracking *how* teams are scoring. There's a massive difference between a team that lives and dies by the jumper and a team that's weaponizing free throws to maximize every possession. One goes cold and costs you money. The other grinds out value even on off-shooting nights.
Enter the Denver Nuggets and their recent offensive clinic that's hiding in plain sight.
---
The Metric The Public Ignores (And Why It's Costing You)
Let me introduce you to two numbers that tell completely different stories:
**Effective Field Goal Percentage (eFG%)** – Measures shooting efficiency, giving extra weight to three-pointers. It's a solid metric, but it only tells you about *shots made*.
**True Shooting Percentage (TS%)** – Measures *total scoring efficiency* by factoring in free throws. This is the metric that separates pretenders from contenders because it reveals which teams are creating high-value contact and controlling the game at the charity stripe.
When TS% consistently outpaces eFG%, you're watching a team that knows how to score even when the shooting isn't pretty. They're getting to the line. They're drawing fouls. They're turning defense into offense without needing a lucky shooting night.
And right now? **The Nuggets are running a masterclass.**
---
The Numbers Don't Lie
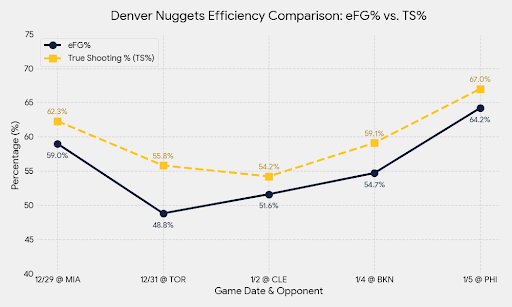
Over their last 5 games, Denver has shown a consistent and telling gap between their eFG% and TS%. Check this out:
**12/31 @ Toronto:**
eFG%: 48.8% | TS%: 55.8% | **Gap: +7.0%**
**01/01 vs. Atlanta:**
eFG%: 59.5% | TS%: 61.3% | **Gap: +1.8%**
**01/03 vs. Cleveland:**
eFG%: 58.5% | TS%: 60.8% | **Gap: +2.3%**
**01/05 @ Philadelphia:**
eFG%: 64.2% | TS%: 67.0% | **Gap: +2.8%**
**01/07 vs. Phoenix:**
eFG%: 52.0% | TS%: 55.1% | **Gap: +3.1%**
Notice the pattern? **In 4 of the last 5 games, Denver's True Shooting has significantly outpaced their field goal efficiency.** That Toronto game is the smoking gun — they shot under 50% from the field but still posted a 55.8% True Shooting because they absolutely dominated at the free-throw line.
This isn't luck. This is a strategic offensive identity.
---
Why This Changes Everything
Here's what the sharps already figured out: **Without Jokic in the lineup for stretches, many expected Denver's offense to crumble.** The narrative was that they'd lose their playmaking hub, their interior presence, their entire offensive ecosystem.
Instead, we're seeing something fascinating. Guys like **Jamal Murray** and **Peyton Watson** are playing with hyper-aggression. They're attacking the rim with purpose. They're forcing defenders into foul trouble. They're turning 40% shooting nights into efficient offensive performances because they're living at the line.
This is disciplined, well-coached basketball. When TS% stays consistently elevated above eFG%, it signals a team that understands possessions aren't just about making shots — they're about *maximizing value per possession*.
Denver is generating "and-1s." They're drawing shooting fouls in the bonus. They're controlling the pace and putting opponents in rotation hell by the third quarter.
---
The Betting Edge (And How To Use It)
So what does this mean for your bankroll?
When you see a team consistently posting TS% numbers 2-4 points above their eFG%, **you're looking at an offense that can hit team totals even when they're not shooting lights out.** This makes them incredibly dangerous in high-total games where the market expects shootouts but doesn't account for free-throw efficiency.
**Actionable insights:**
1. **Back Denver team totals in high-pace matchups** – Their ability to generate free points at the stripe means they can exceed expectations even on mediocre shooting nights.
2. **Fade unders when Denver is the underdog** – Teams that trail often foul more in late-game situations, which plays directly into Denver's efficiency profile.
3. **Target player props for Murray and Watson** – Both are showing elite free-throw rates right now. Points props are mispriced when books only account for field goals.
The public is still betting Denver based on whether Jokic is playing. The sharps are betting them based on their offensive structure and free-throw generation. One group is losing. The other is cashing.
---
The Question Everyone's Asking
**Is this sustainable without the Joker, or are they just riding a hot streak?**
Honestly? The sample size is small, but the *process* is legit. This isn't random variance — it's a systematic approach to attacking defenses that can't afford to foul. As long as Murray stays aggressive and the supporting cast maintains this attacking mentality, the efficiency metrics should hold.
But the moment that TS% gap shrinks and starts mirroring eFG%? That's your signal the heater is cooling off.
---
Don't Just Watch The Game — Decode It
The difference between winning bettors and losing bettors isn't luck. It's information. While everyone else is checking if shots are falling, you're tracking *how* teams are scoring and where the market hasn't adjusted yet.
Want the rest of this week's advanced analytics breakdowns? I've got **5 more efficiency plays** backed by data most bettors will never see. We're hitting **71% ATS over the last 3 weeks** because we're betting the math, not the narrative.
**[Join Basketball Picks VIP – 10 Days Free →]**
10 days free. The edge is priceless.
---
*Gambling Problem? Call 1-800-GAMBLER. Basketball Picks VIP is not a gambling operator. This content is for entertainment and informational purposes only. Must be 21+. Odds are subject to change. Please bet responsibly.*
Comments
Post a Comment